Web app
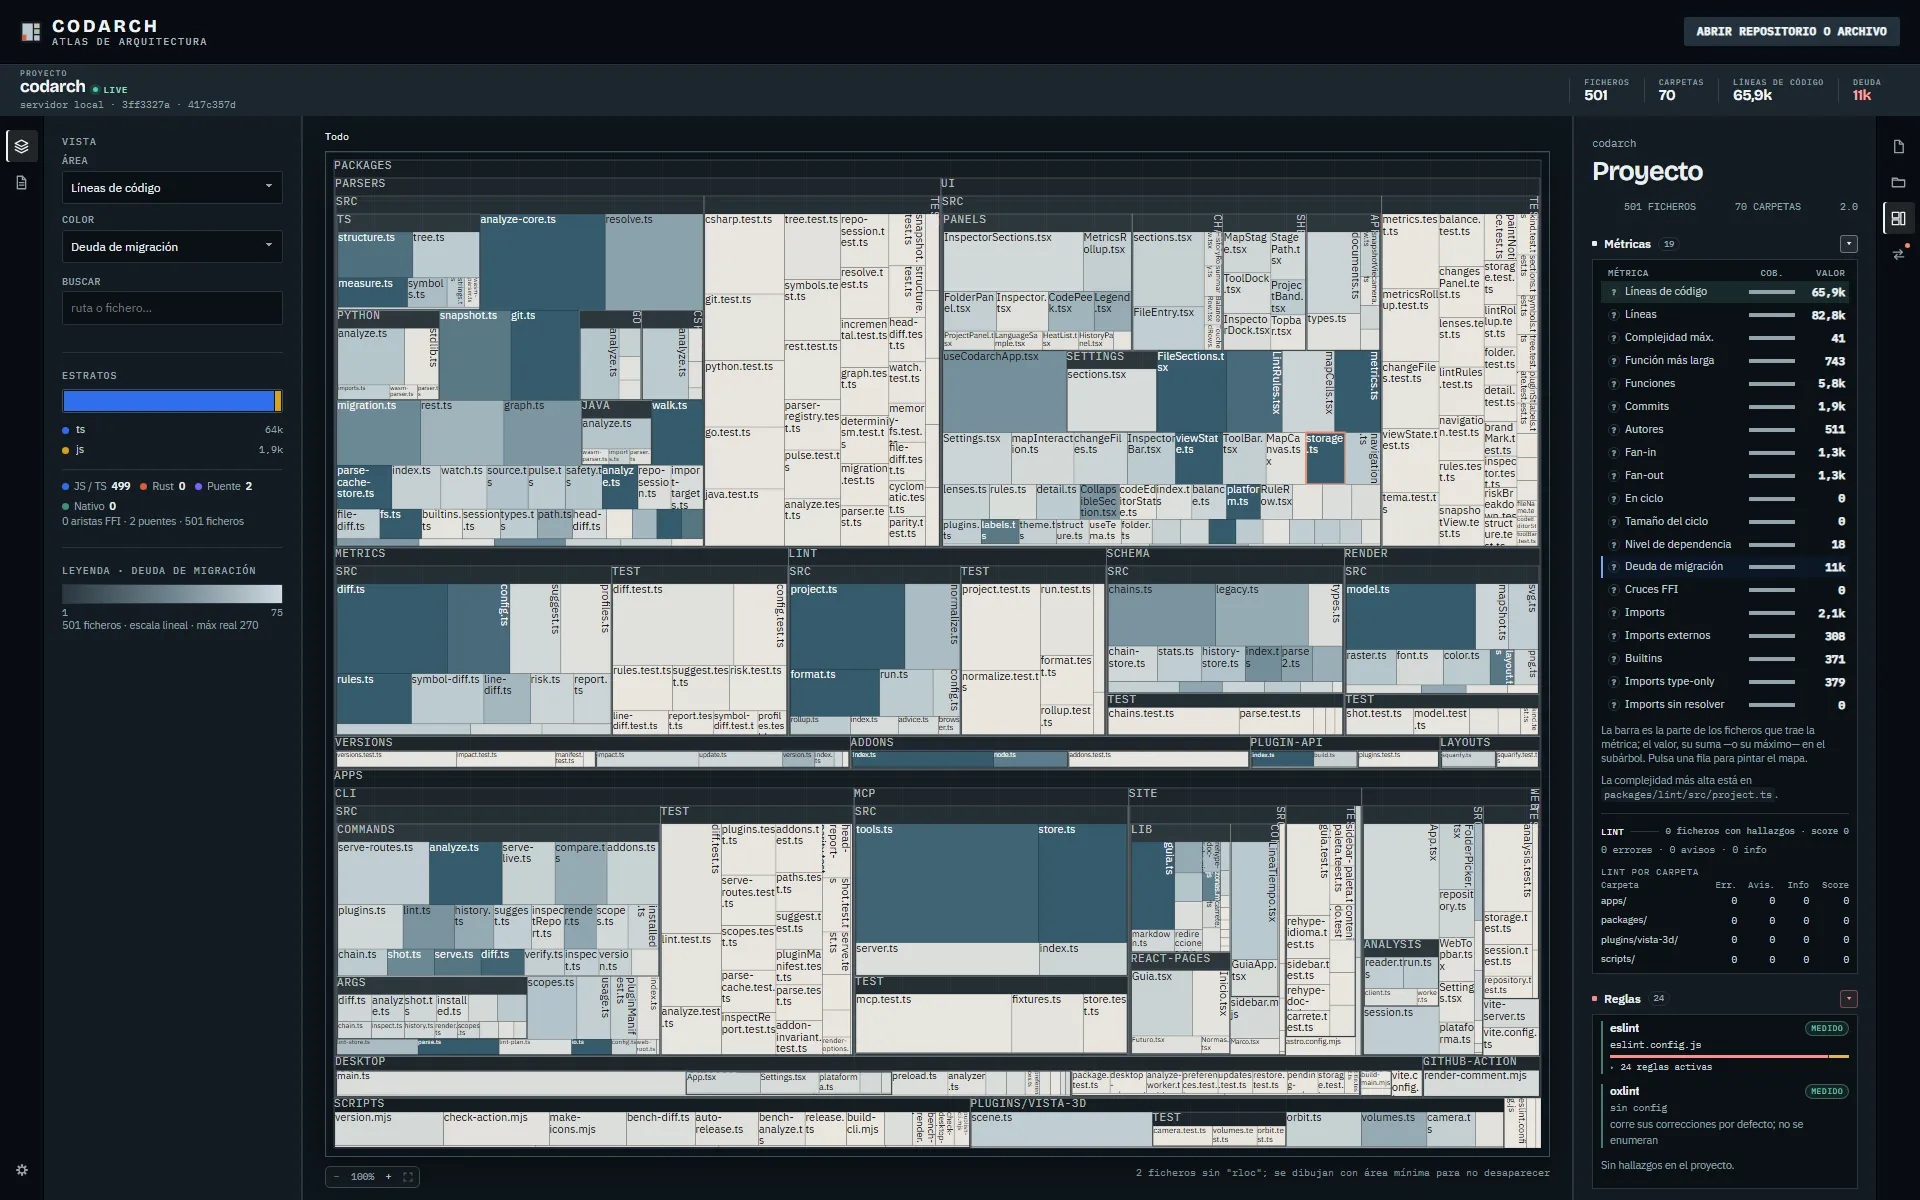
The web app is the map in the browser: the treemap, the VISTA panel with its ÁREA and COLOR
selectors, and the inspector with its four entries: Fichero, Carpeta, Proyecto and Cambios. It does not
analyse on its own in the browser: it analyses through codarch serve, which reads the repository
from disk and hands it the snapshot.
Two ways to open it
Section titled “Two ways to open it”With the CLI (the same installation)
Section titled “With the CLI (the same installation)”npm i -g codarch already brings the web app. It opens with:
codarch serve .serve is not another way to install: it serves the web app that ships with the CLI, locally, and
re-analyses on save. Its version is the CLI’s. See codarch serve.
On its own, with Docker
Section titled “On its own, with Docker”Without installing Node, with the published image and your repo mounted read-only:
docker run --rm -p 127.0.0.1:4173:4173 \ -v "$PWD":/workspace:ro \ ghcr.io/jaminsmoke/codarch-web:latestOpen http://localhost:4173. Inside runs the same codarch serve over /workspace; the container
listens on loopback only and never writes to the repo.
If you have cloned the CodArch repository, you can also build and start it from there:
docker compose up --buildCODARCH_REPO=/path/to/repo docker compose up --build # to look at another repo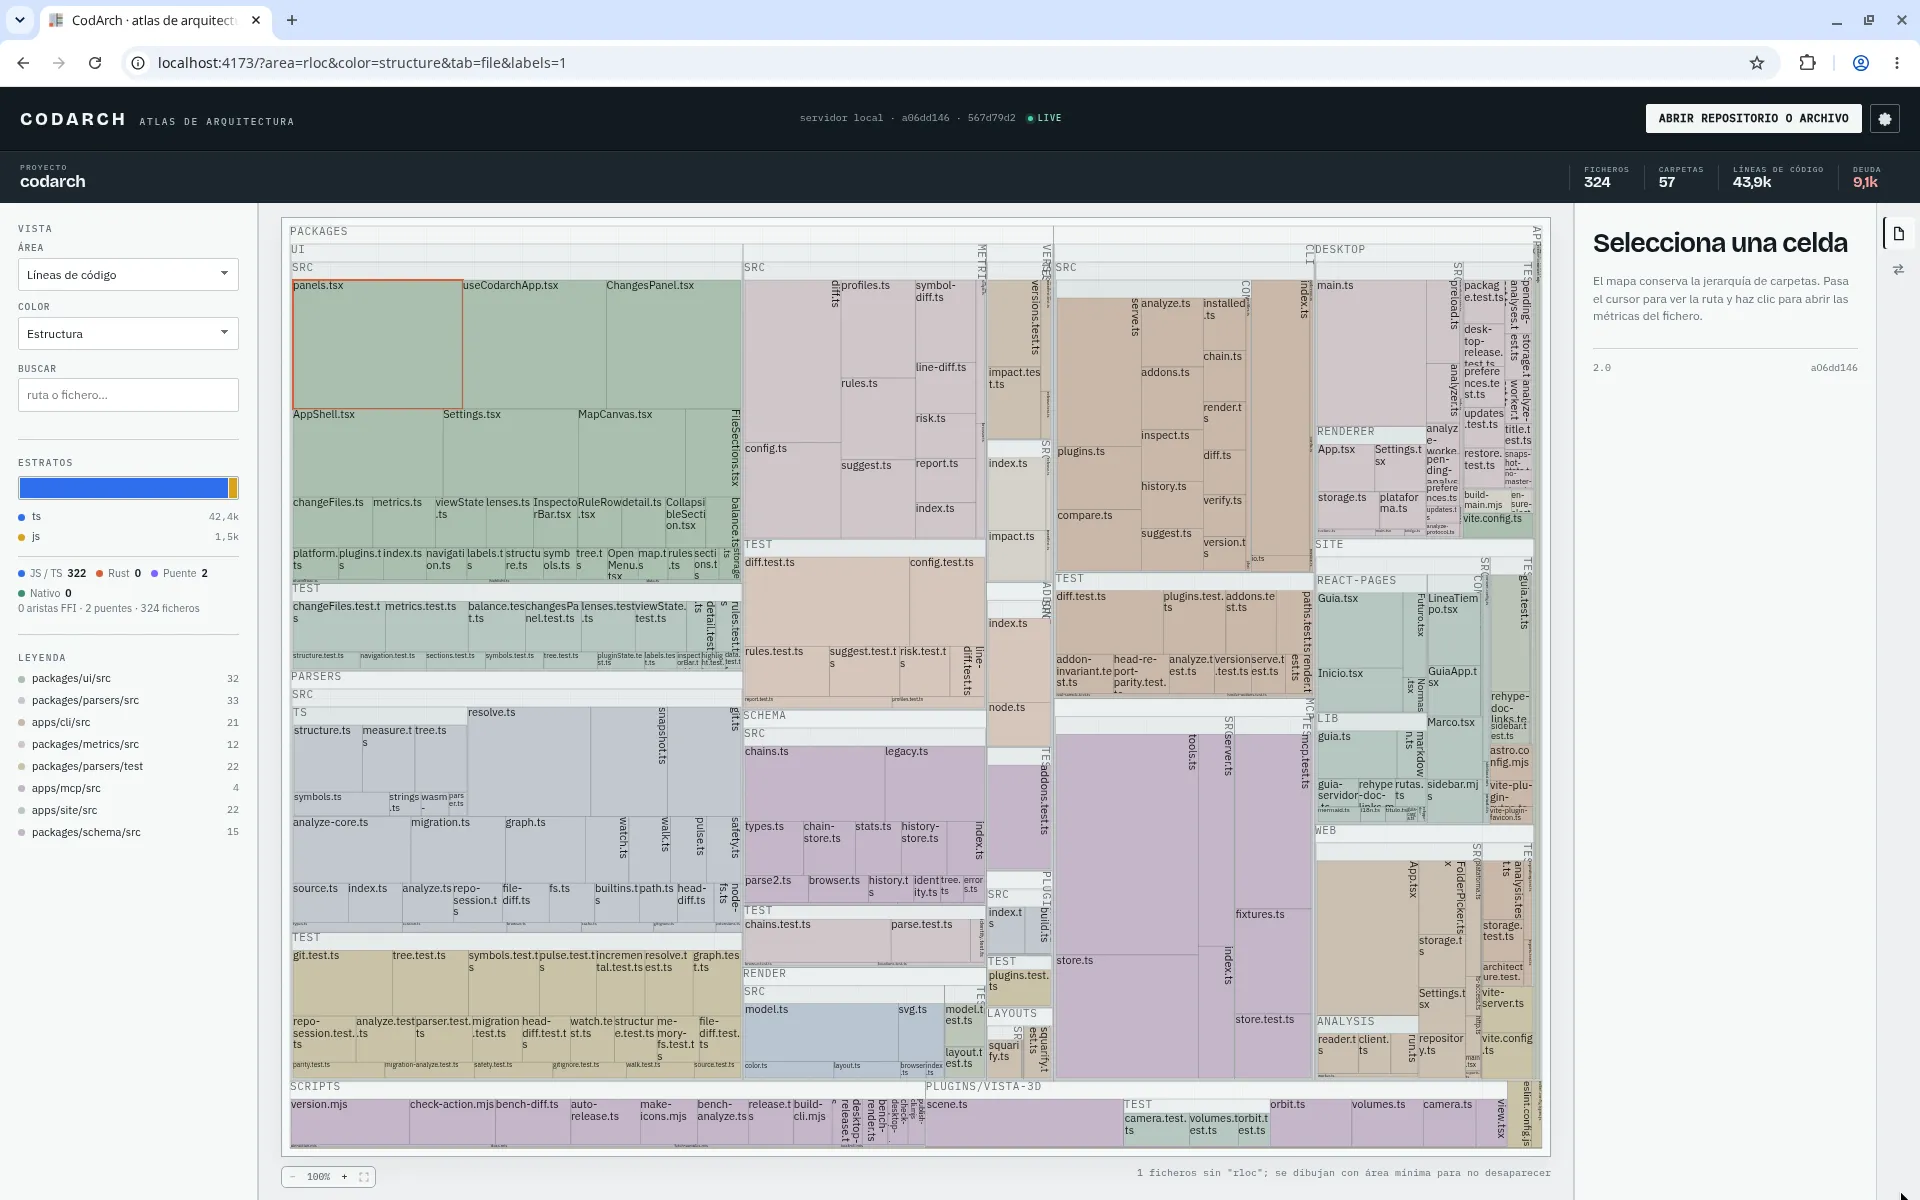
The map: ÁREA and COLOR
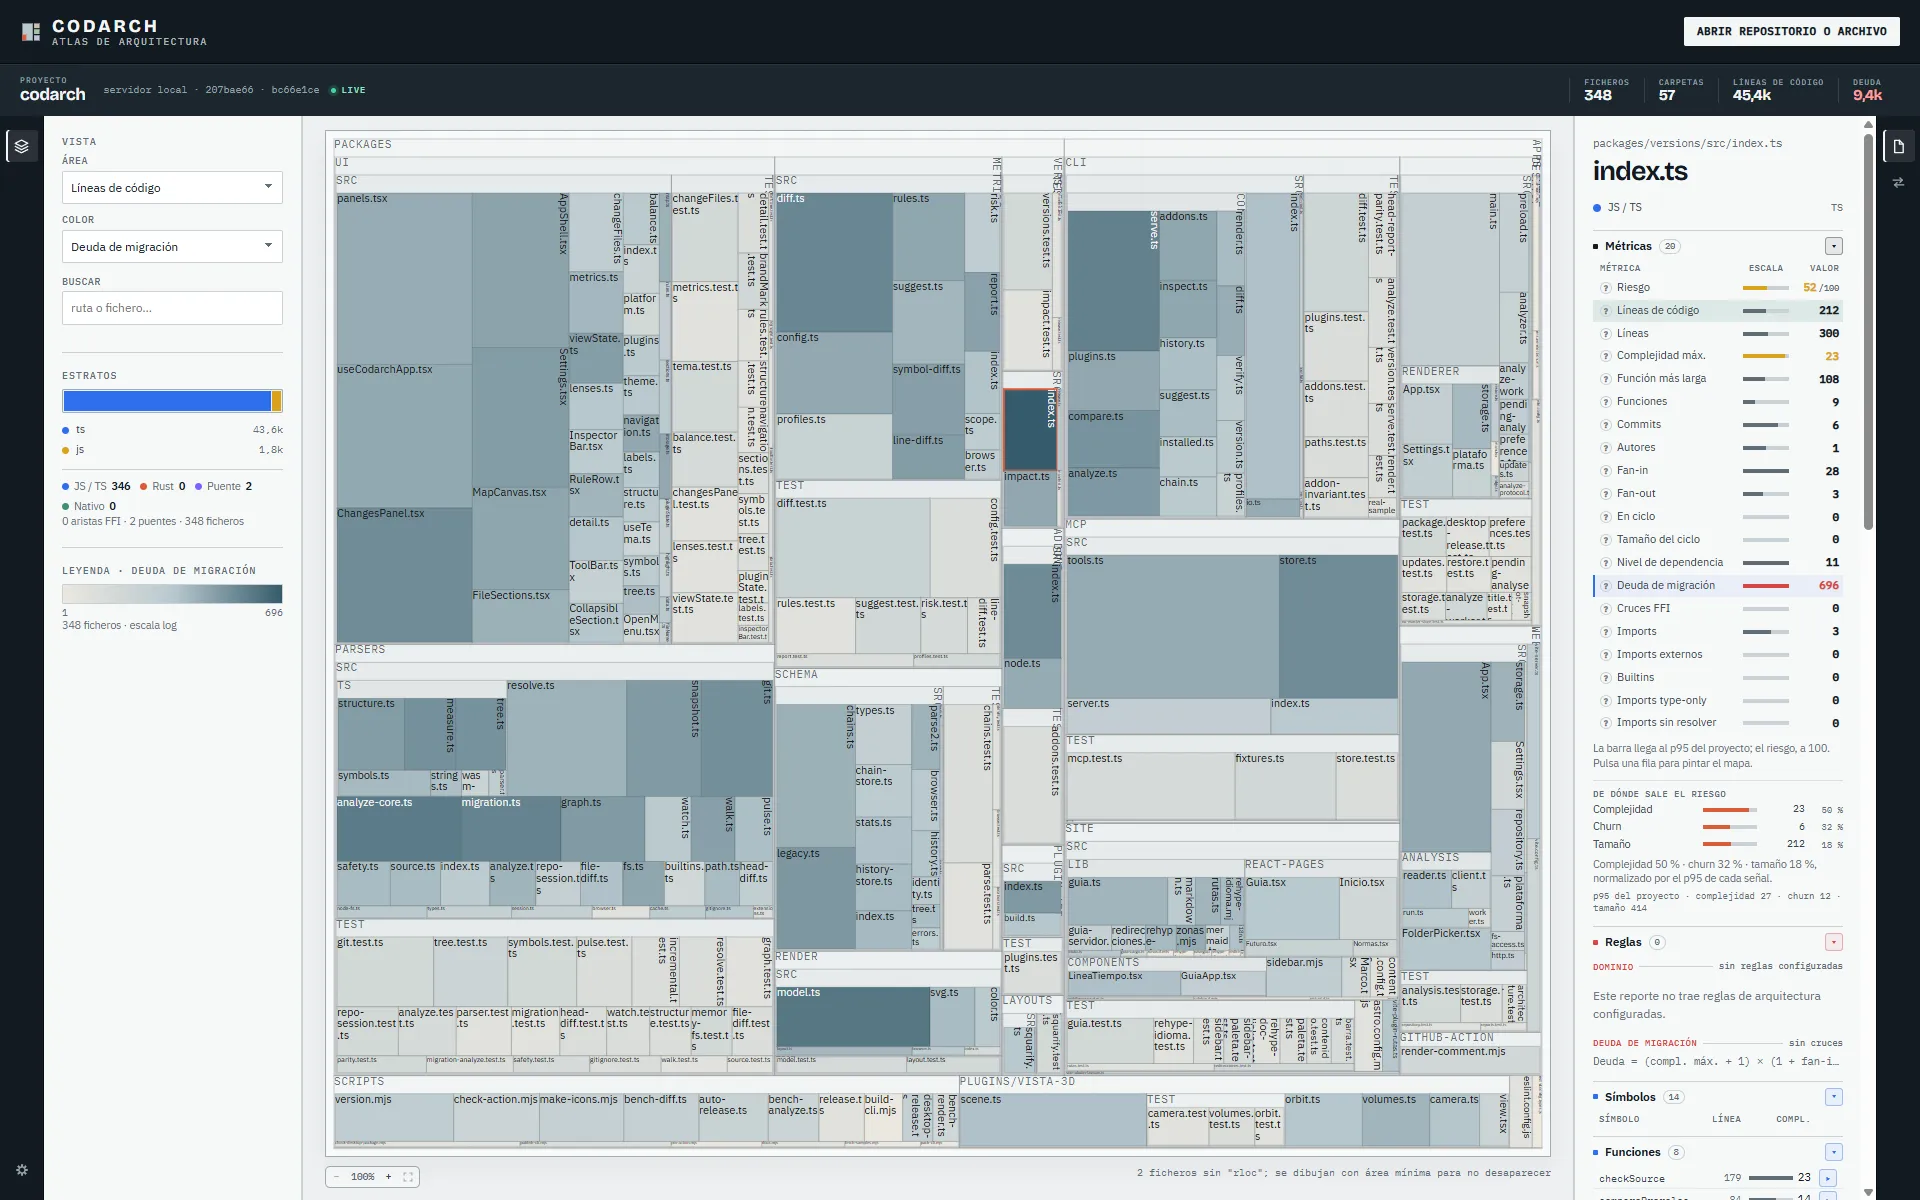
Section titled “The map: ÁREA and COLOR”Each block is a folder or a file. There is no «lenses» menu: they are the two selectors of the VISTA panel, on the left.
- ÁREA decides the size of each block (the metric).
- COLOR decides how it is painted: Riesgo (risk), Estructura (structure), Lint, Color
(commits), Estado de migración (migration status), Deuda de migración (migration debt), among
others. When a repo opens, the default lens is Deuda de migración. Lint paints each file with
its debt —errors + ¼ warnings— over the map’s maximum, and appears when the tree you are looking at
has measured lint:
codarch analyzemeasures it in the same pass as the other lenses, andcodarch serveonly re-measures it when the tree changed.
The layers icon, in the tool bar on the left, folds that panel away and leaves the map full screen; the app remembers whether it was folded.
Next to it is the Docs y config button: the map of what is not code —documents, configuration and
assets—, which has its own snapshot and its own checksum. Clicking a map’s button opens that map;
clicking the button of the map already open folds the panel. If the repo has no rest.cc.json, the button is shown greyed
out. In that map the area is the file size and the colour is its kind —documents, configuration,
assets or other—, and the Estratos block counts how many there are of each. Whatever only speaks
about code —languages, symbols and heat— disappears from the panel.
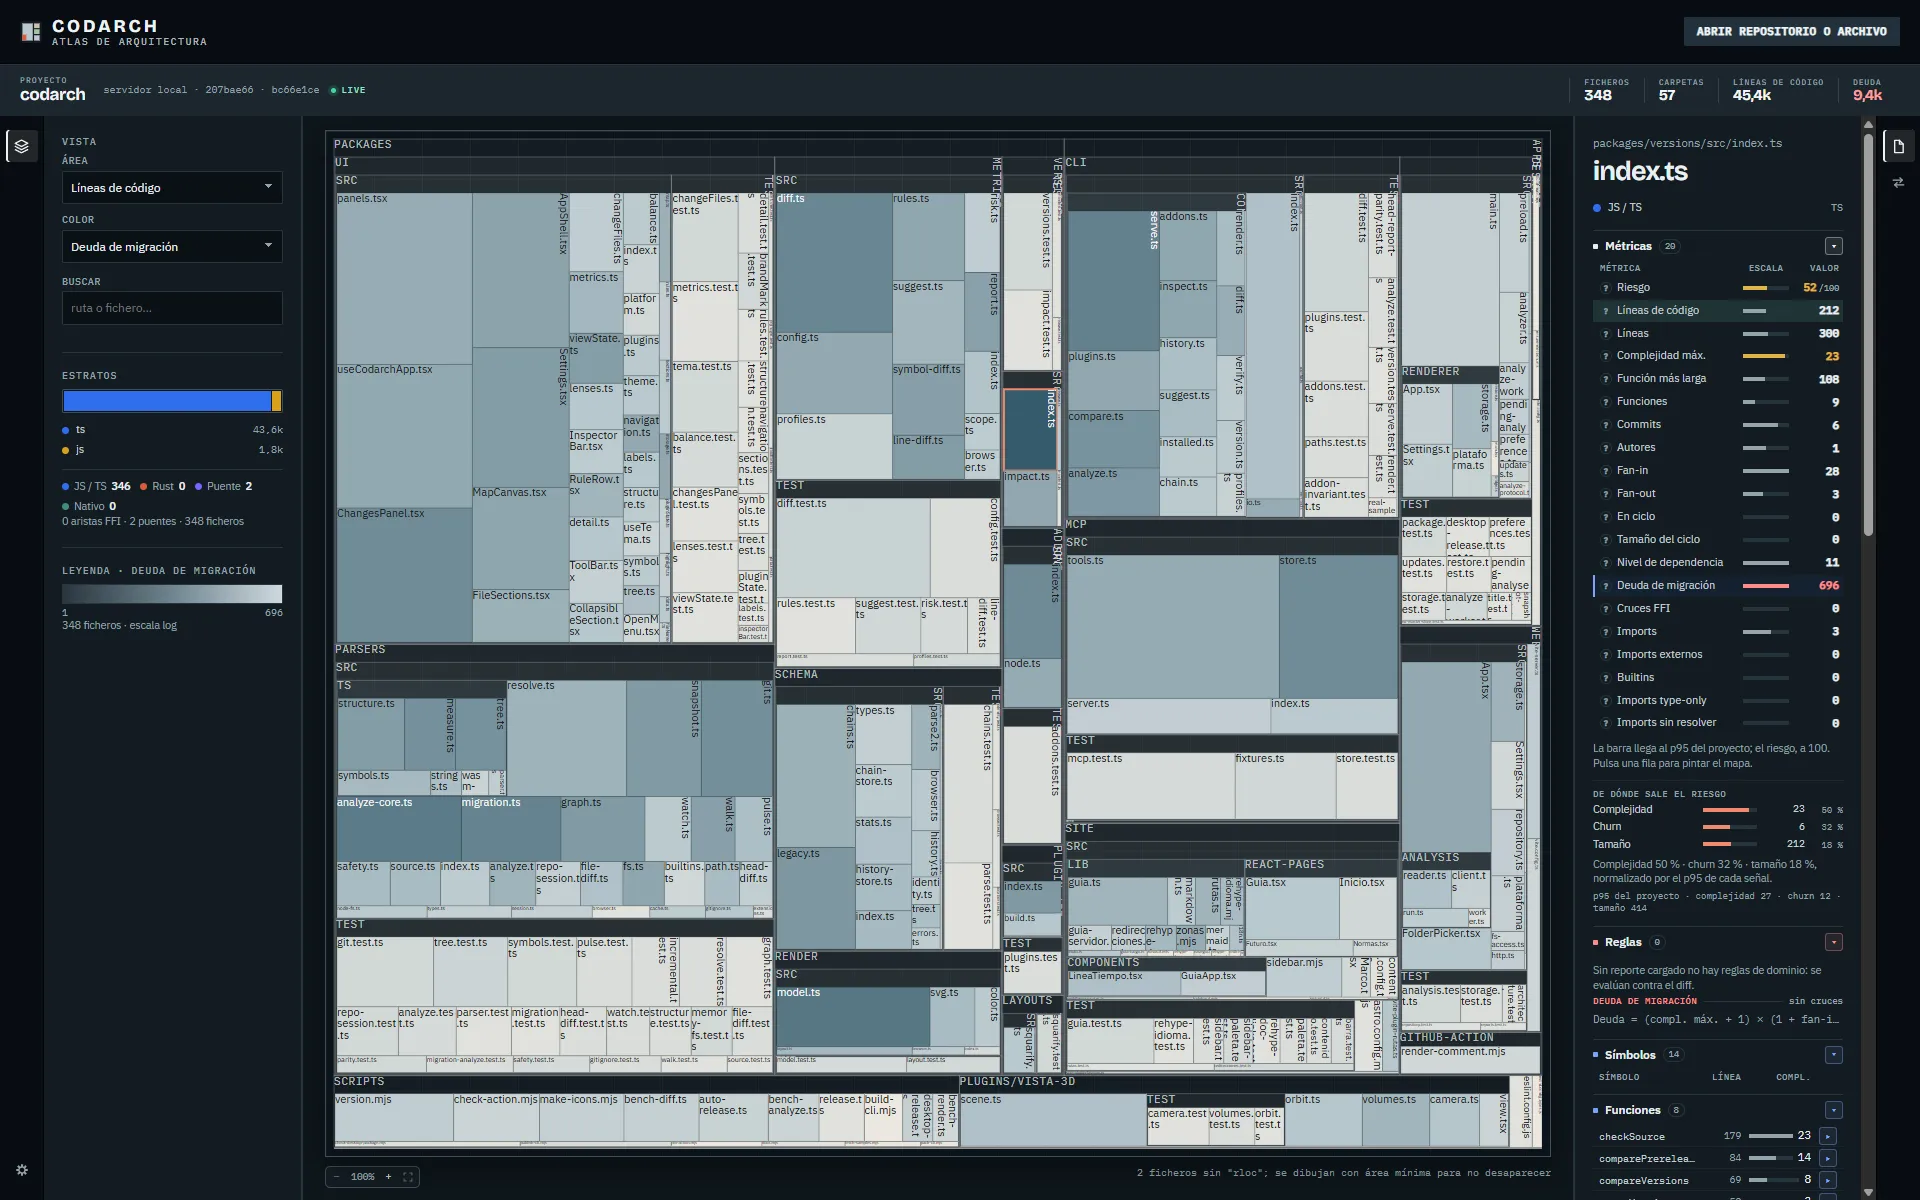
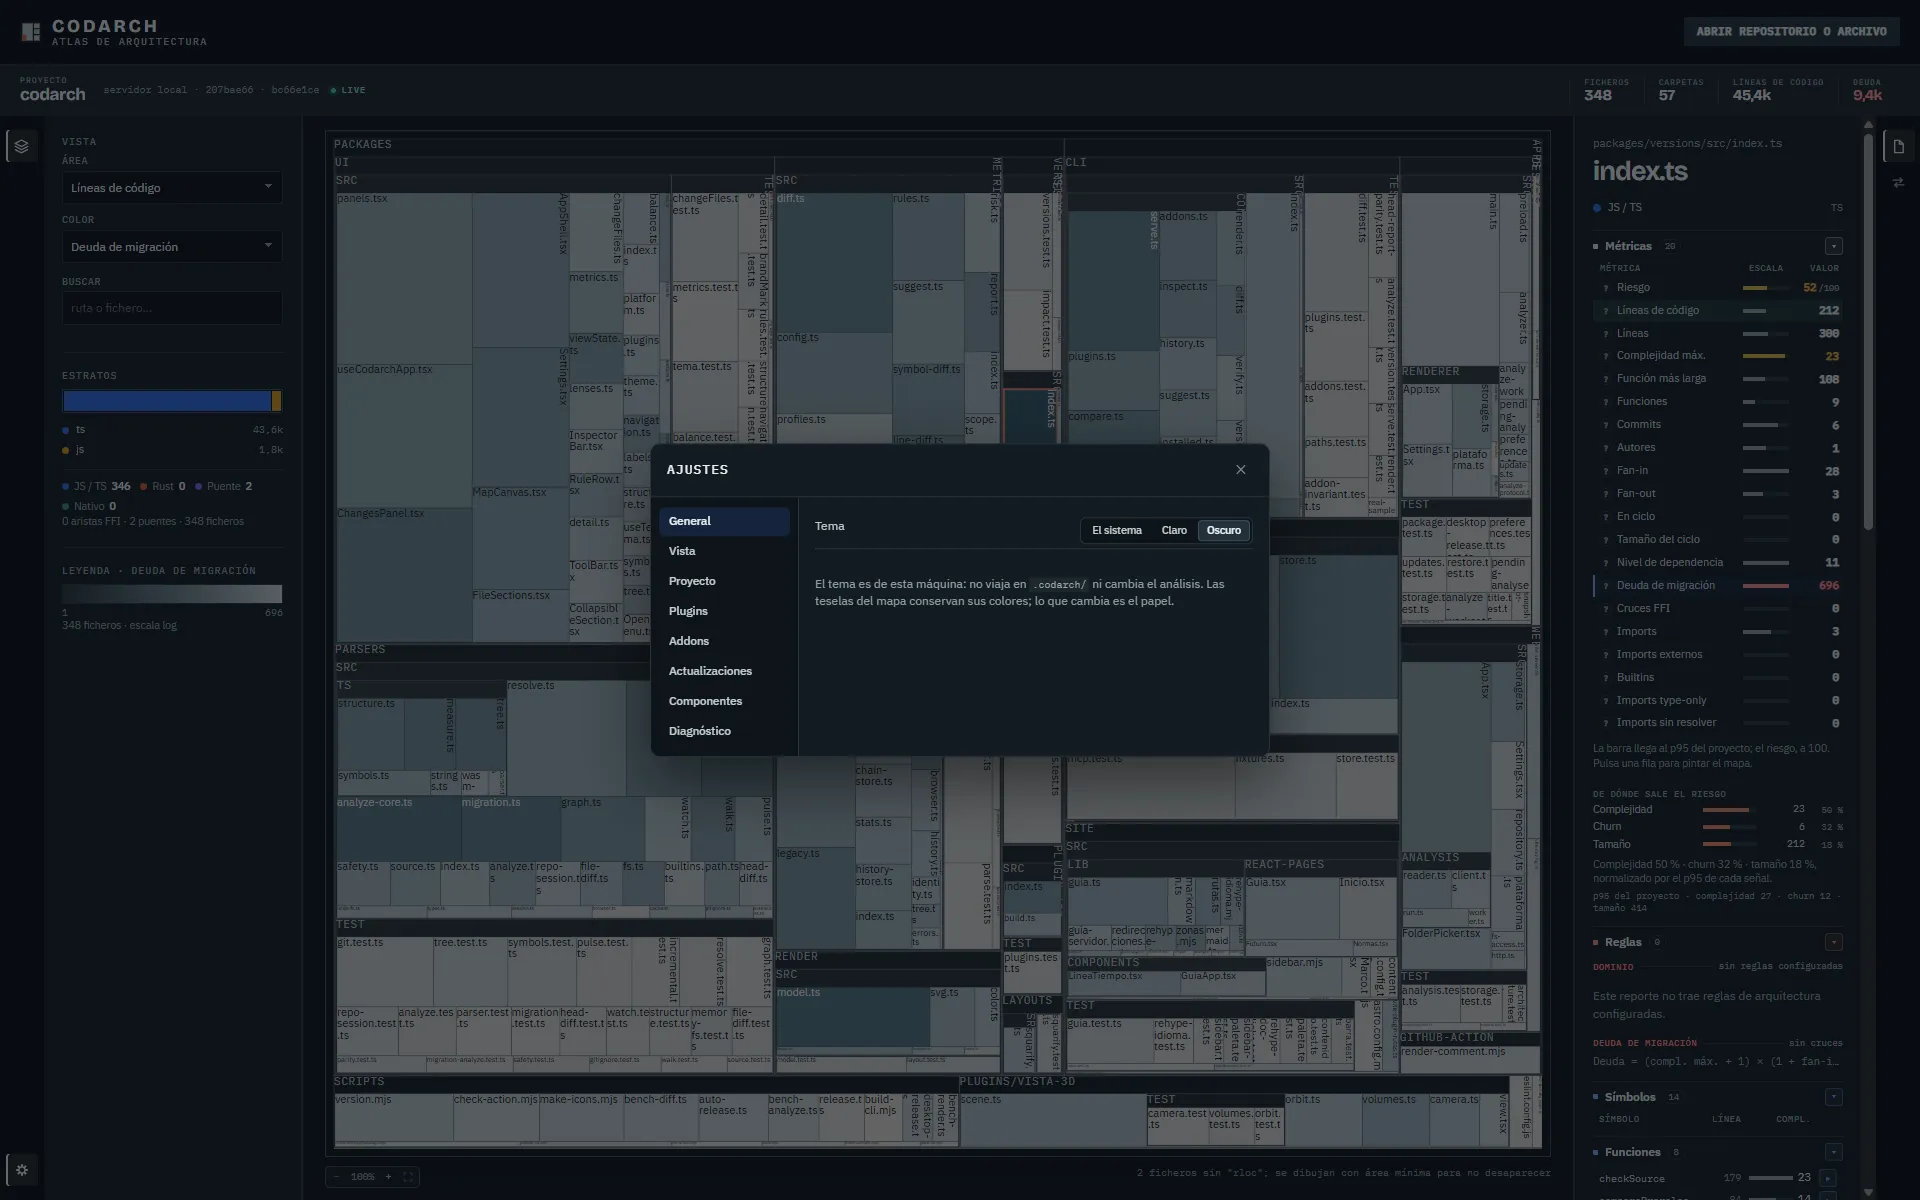
With the dark theme the paper drops and the tiles keep their colour: the map still reads the same (see Ajustes › General).
The map’s path
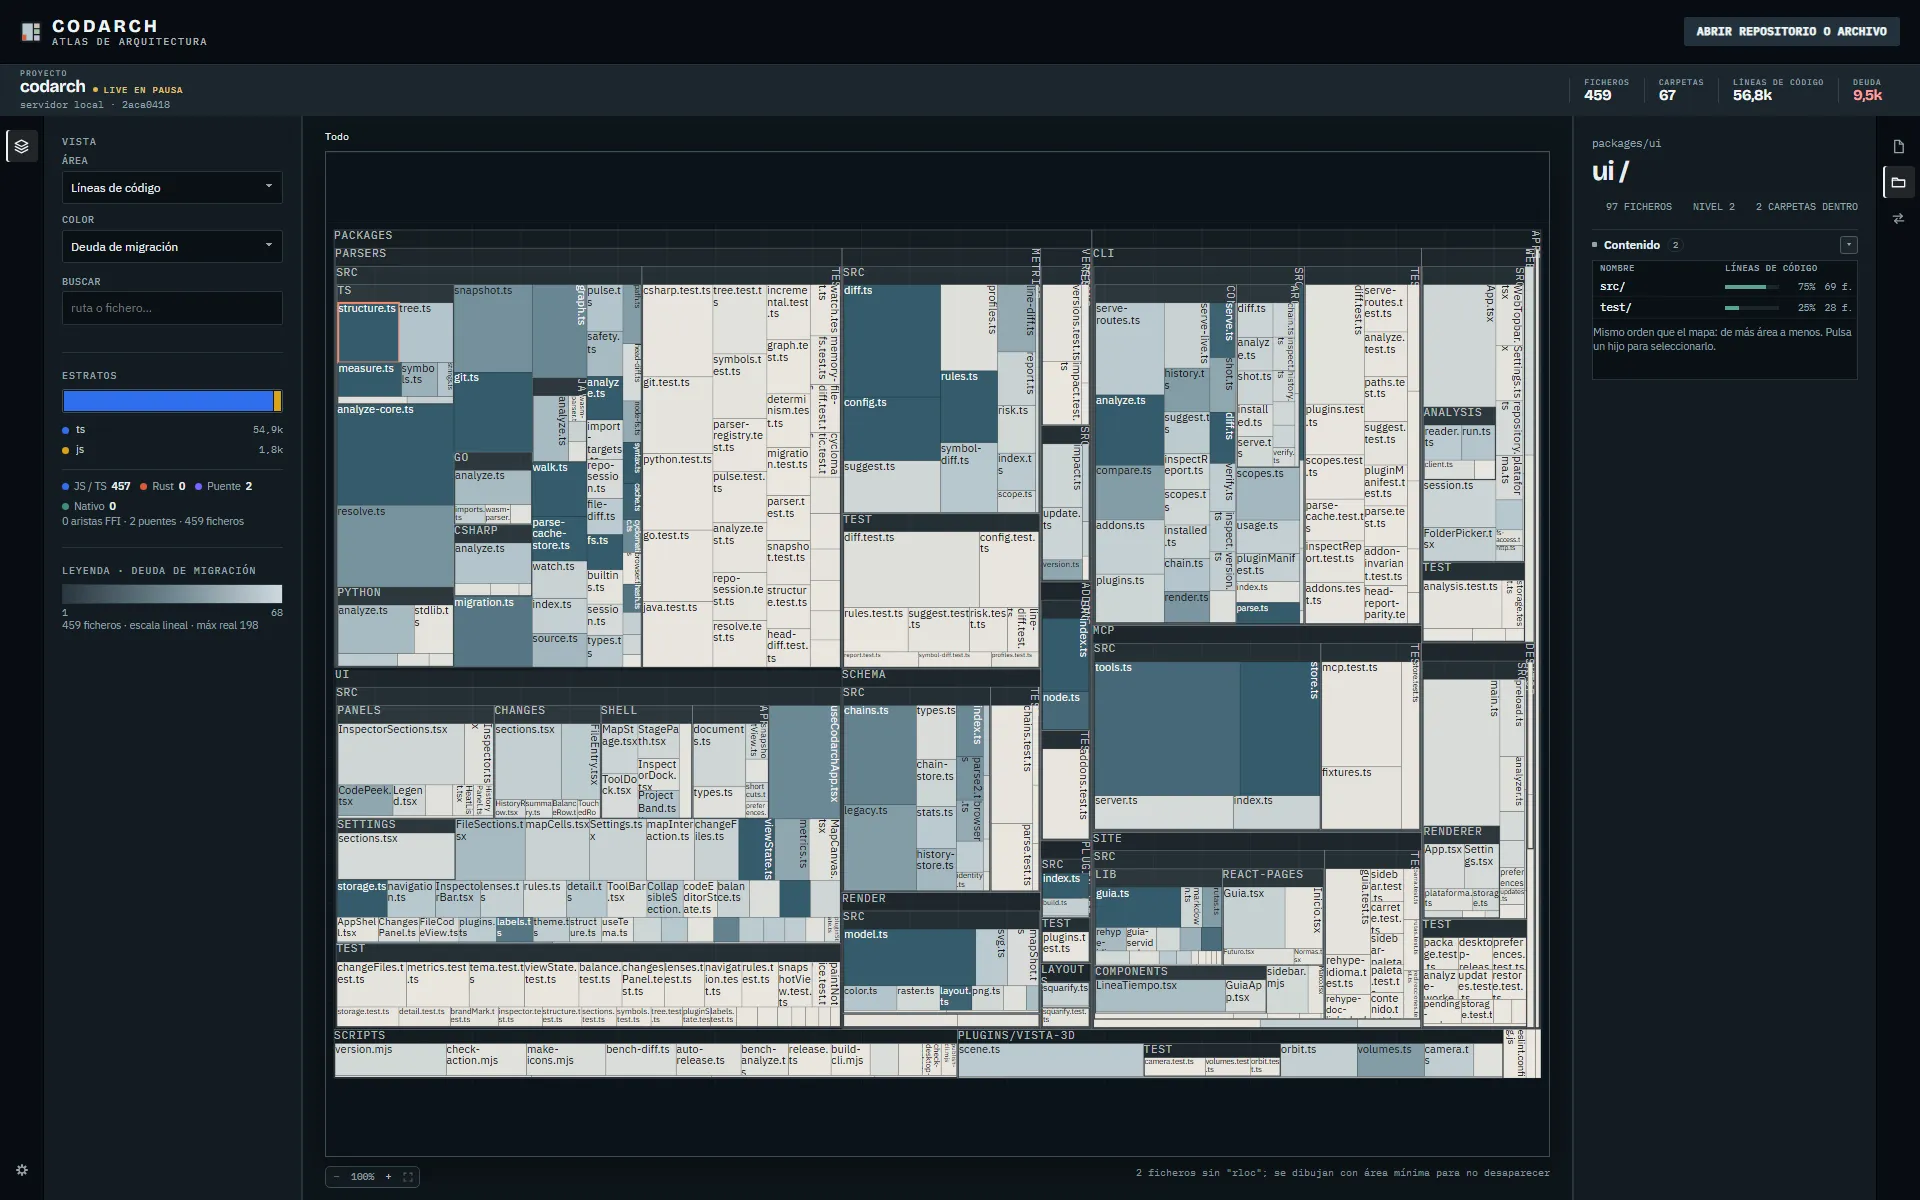
Section titled “The map’s path”The path is always above the map. With no folder focused it says Todo (all) only, which is where
you are; once you are inside a folder, every segment becomes a button: Todo / packages / ui. A
click on a segment selects that folder —its ficha appears in the right panel without moving the
zoom— and a double click enters it; Todo selects the whole map. The arrow goes up one level
and Esc and backspace clear the view. The path navigates the map, it does not describe the project,
and that is why it lives here and not in the band above.
In the map, a click selects what the cell holds —a file or a folder— and a double click
enters: the file opens its code, the folder zooms. With the keyboard, Enter enters and Space
selects. The selected folder goes in the URL with the sel key; the file, with file.
Double-clicking a file’s block gives the map’s place to the whole file, read-only: the path
becomes Todo / packages / ui / useCodarchApp.tsx and any segment —or Esc, or the ← Mapa
button in the header— brings the map back. There is no tab and no separate view, and the file stays
selected in the sheet. The open file goes in the URL with the code key, so a shared link opens that
code directly.
ABRIR REPOSITORIO O ARCHIVO
Section titled “ABRIR REPOSITORIO O ARCHIVO”This is the main way to open a repository, here and in the desktop app. The ABRIR REPOSITORIO O ARCHIVO (open repository or file) header button opens a drop-down with these options:
- Monitorizar carpeta (live)…: analyses the folder and analyses again on save.
- Carpeta con .codarch…: opens what is already in a repo’s
.codarch/folder. - Analizar carpeta aquí…: analyses a folder once.
- Archivo cc.json…: opens a standalone snapshot.
- Copiar enlace de la vista: copies the URL with the current view.
Below it are the SNAPSHOT POR URL and REPORTE POR URL (OPCIONAL) fields, with the CARGAR POR URL button.
In the desktop app the same button offers Analizar carpeta…, Archivo cc.json… and Reporte
JSON…. Only there are there also keyboard shortcuts (Ctrl+O, Ctrl+Shift+O) and the option to
pass the path as an argument on start (see Desktop app).
Inspector › Fichero
Section titled “Inspector › Fichero”The inspector is the right-hand panel and has four entries in its activity bar: Fichero (file), Carpeta (folder), Proyecto (project) and Cambios (changes). Clicking a file, Fichero shows its metrics, its symbols, its incoming and outgoing dependencies and the lint: the health and the findings of code and of documents that fall on that path. Each finding says which domain and which tool it comes from. Clicking a folder, Carpeta shows how many files it holds, at what depth it sits and what share of its area each child takes, in the map’s own order; selecting a file goes back to Fichero.
Inspector › Carpeta
Section titled “Inspector › Carpeta”Carpeta is the sheet of the selected folder: its path, its files, its depth and its content, with the share of the area each child takes and the files it holds. Clicking a child selects it —if it is a file, it moves to Fichero. Its Métricas section adds up the subtree —files, folders, lines, the maximum complexity with the file that has it, and the lint debt— and ends with Lint por carpeta, one row per child folder that opens its sheet. The table is the file’s, with the same section frame and the same ink: the debt red and the warning ochre come from the worst file in the subtree, and the row’s icon names it. The folder’s lint adds the code and document findings whose path hangs from it. The dependency frontier and the cycles are still on this phase’s roadmap.
Inspector › Proyecto
Section titled “Inspector › Proyecto”Proyecto is the sheet of the whole map, always available: the same Métricas as a folder, added up over the whole repo, and the way down from project to file. Métricas is the file sheet’s table with another subject: one row per metric in the snapshot —name, bar and value—, where the bar is the part of the files that carries the metric and the value is its sum; maxima —complexity, longest function— are shown with the file that holds them, not added up. A maximum measured at zero —no cycles, no FFI crossings— names no file: the zero belongs to all of them, and its tooltip says so. The figures carry the same ink as the file sheet, with the file that puts them in the tooltip. Clicking a row paints the map by that metric. Below, lint with its totals —errors, warnings and info, files with findings out of those measured and its score, errors + ¼ warnings— and Lint por carpeta, one row per top-level folder with its errors, warnings, info and score; clicking one opens that folder’s sheet, which counts the same over its subtree. If the artifact was measured on another tree —the repo changed afterwards—, the sheet says so instead of trusting the figure.
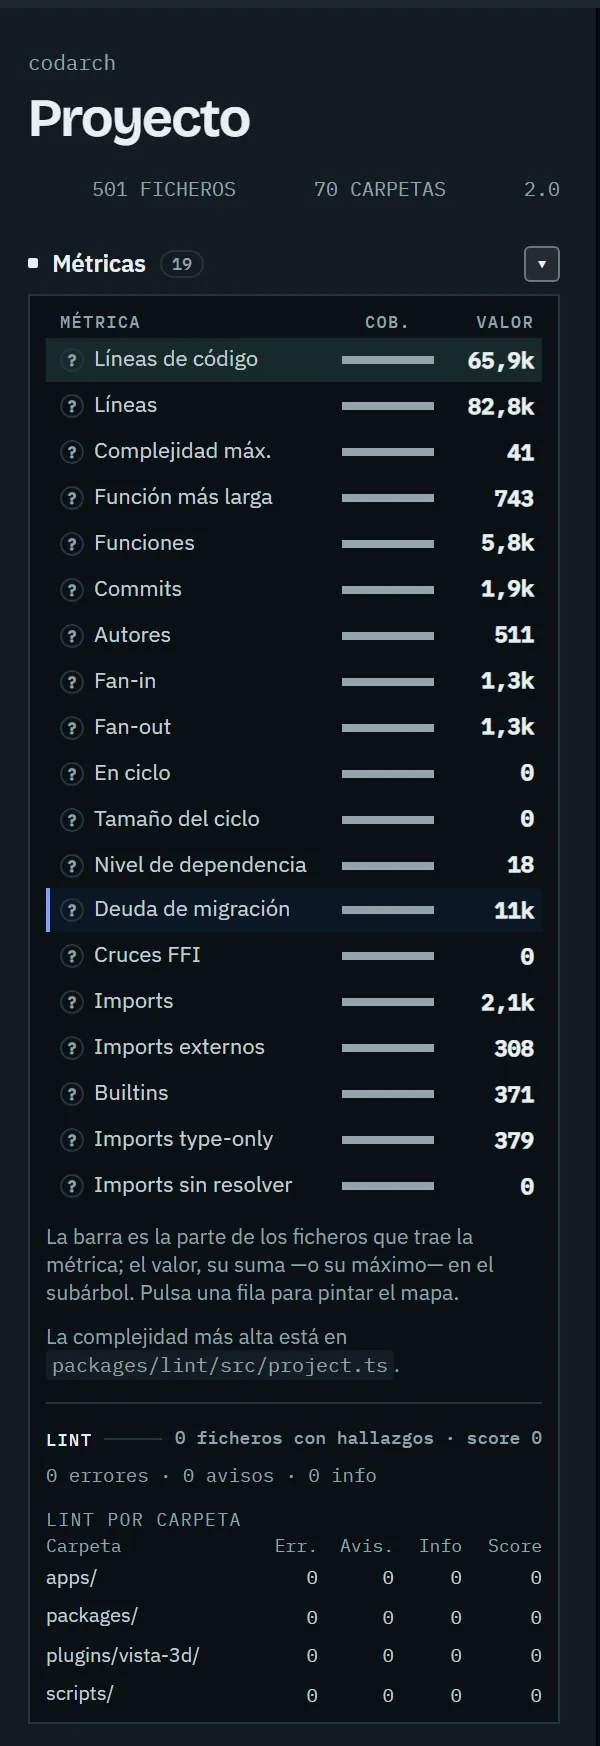
Docs y config shows the catalog, not the findings. Each domain lists its systems: the configuration and the active rules when they are known. If they could not be enumerated —oxlint with no config file, for example— it says the count is unknown; a zero is not painted. An active rule is configured, it has not fired, which is why it carries no debt ink. Findings from both domains are read on the code view, in Fichero, Carpeta and Proyecto, filtered by the selection. An artifact from before per-tool coverage says it was measured with an earlier version: it is not a clean scope.
When coverage is complete and the tree is up to date, the lint block says “Clean and up to date” in the project, folder and file cards, without the row of zeros; otherwise it shows errors, warnings and info and the reason. In the project card, below, there is one row per tool with its state —ok, measured, partial coverage or unmeasured—, its config file, its active rules and its measured files. A tool’s missing config file is stated in its row —“no config file: it runs its default rules and they are not enumerated”— and it does not stop calling clean what was measured whole.
Without .codarch/lint.repmod.json there are no zeros: the lint block says sin medir (unmeasured) and
what it will weigh once codarch analyze runs, which measures it with the project’s
linter.
There is no «project risk»: risk is normalised by the project’s p95 and belongs to each file, so it is read in the file’s sheet.
Inspector › Cambios
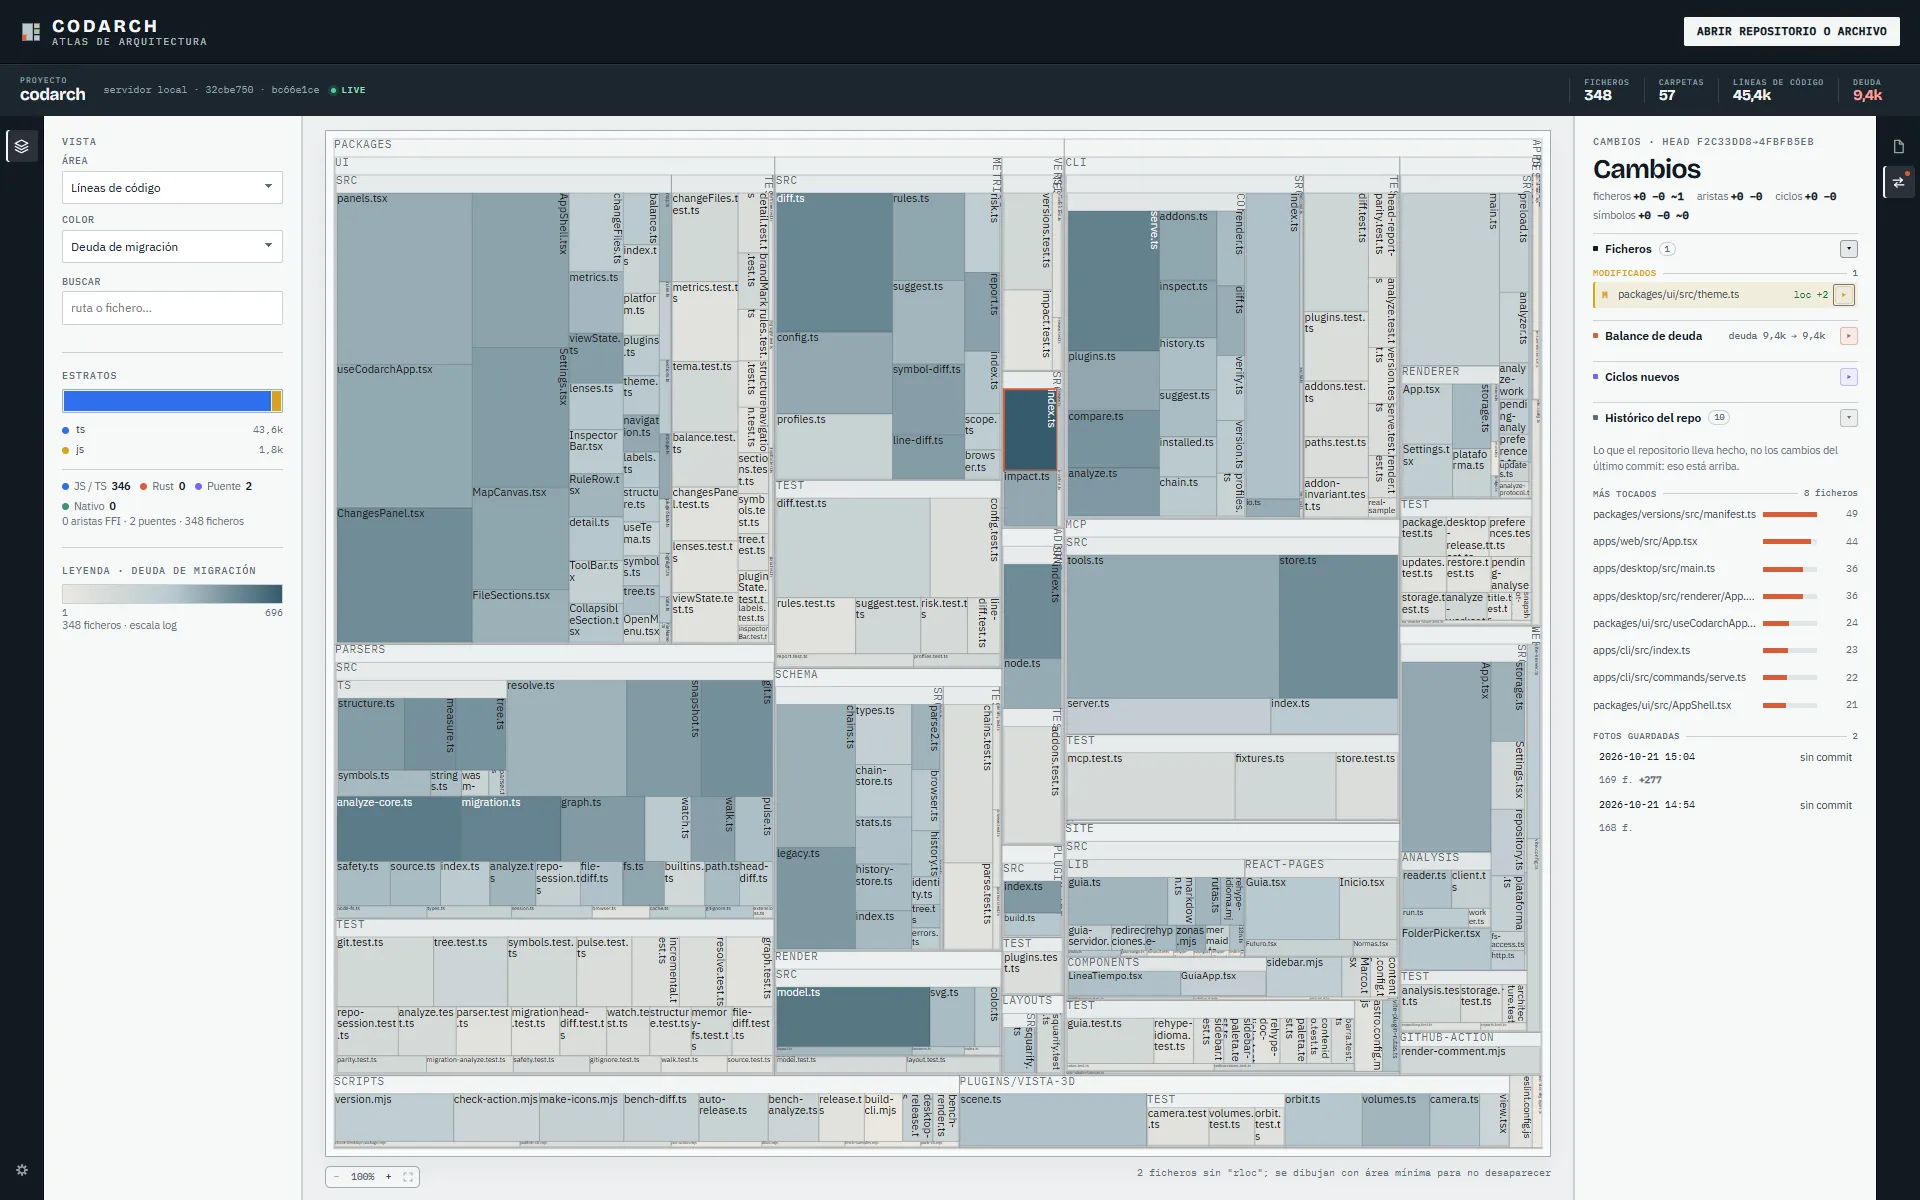
Section titled “Inspector › Cambios”The Cambios (changes) tab shows what has changed: what was touched since the last commit and, if a report was loaded, the modified and deleted files with their rules.
Comparing two versions: REPORTE POR URL
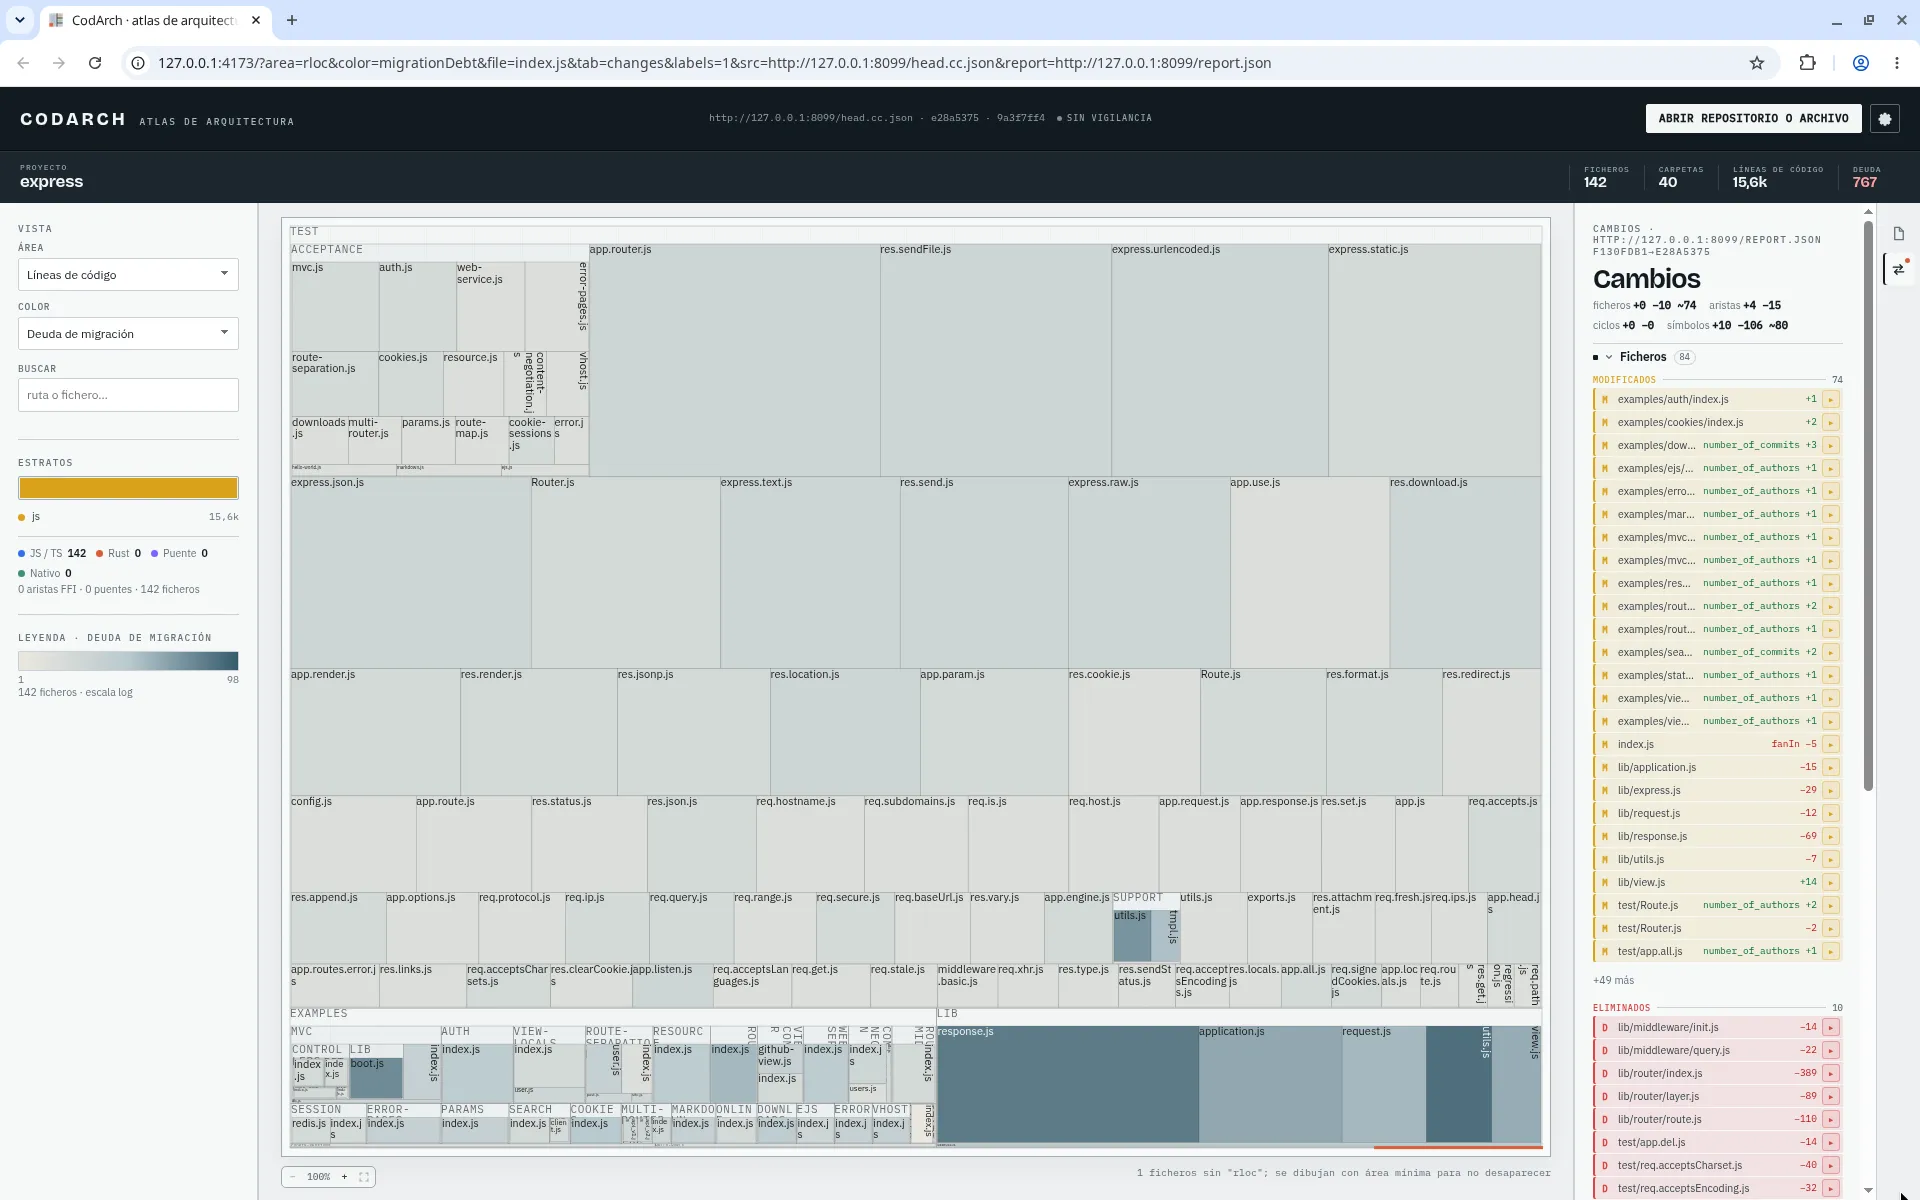
Section titled “Comparing two versions: REPORTE POR URL”There is no dedicated PR or diff view. To compare two versions:
-
Generate the report with the CLI:
Ventana de terminal codarch diff base.cc.json head.cc.json -o reporte.json -
Load the head snapshot in SNAPSHOT POR URL and the report in REPORTE POR URL (OPCIONAL), and press CARGAR POR URL.
The result shows in the inspector’s Cambios tab, with the modified and deleted files. See
codarch diff.
Histórico del repo
Section titled “Histórico del repo”There is no separate history view either. Inside the Cambios tab, the Histórico del repo (repo history) section shows MÁS TOCADOS (most touched) and FOTOS GUARDADAS (saved snapshots). It is generated with:
codarch analyze --history
Ajustes
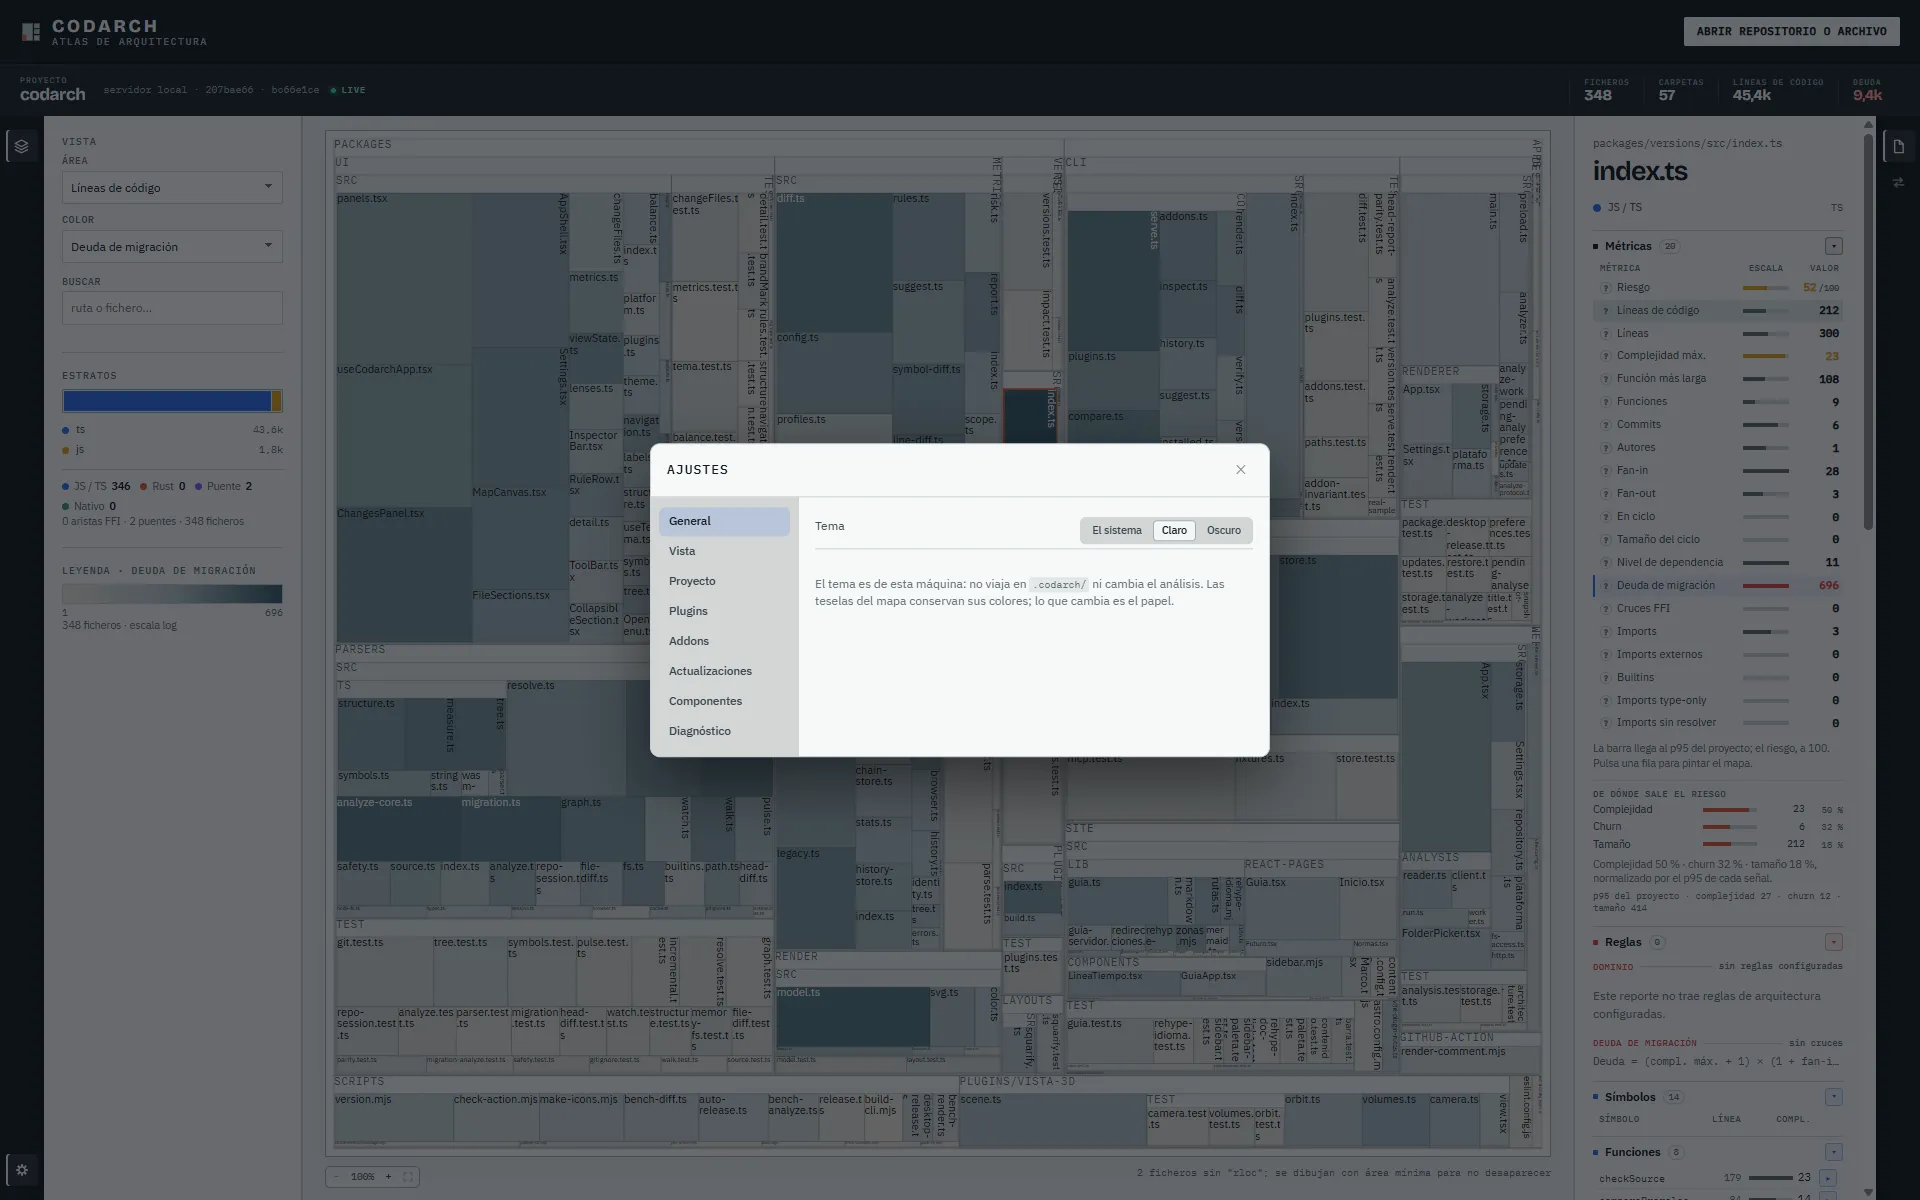
Section titled “Ajustes”The gear at the foot of the tool bar —the strip of icons to the left of the map— opens Ajustes (settings), with its sections General, Vista, Proyecto, Plugins, Addons, Actualizaciones, Componentes and Diagnóstico.
Ajustes › General
Section titled “Ajustes › General”General picks the app’s theme: Claro, Oscuro or El sistema. It is a preference of this
machine —it does not travel in .codarch/ and does not change the analysis— and the map’s tiles keep
their colours: what changes is the paper.
Ajustes › Plugins and Ajustes › Addons
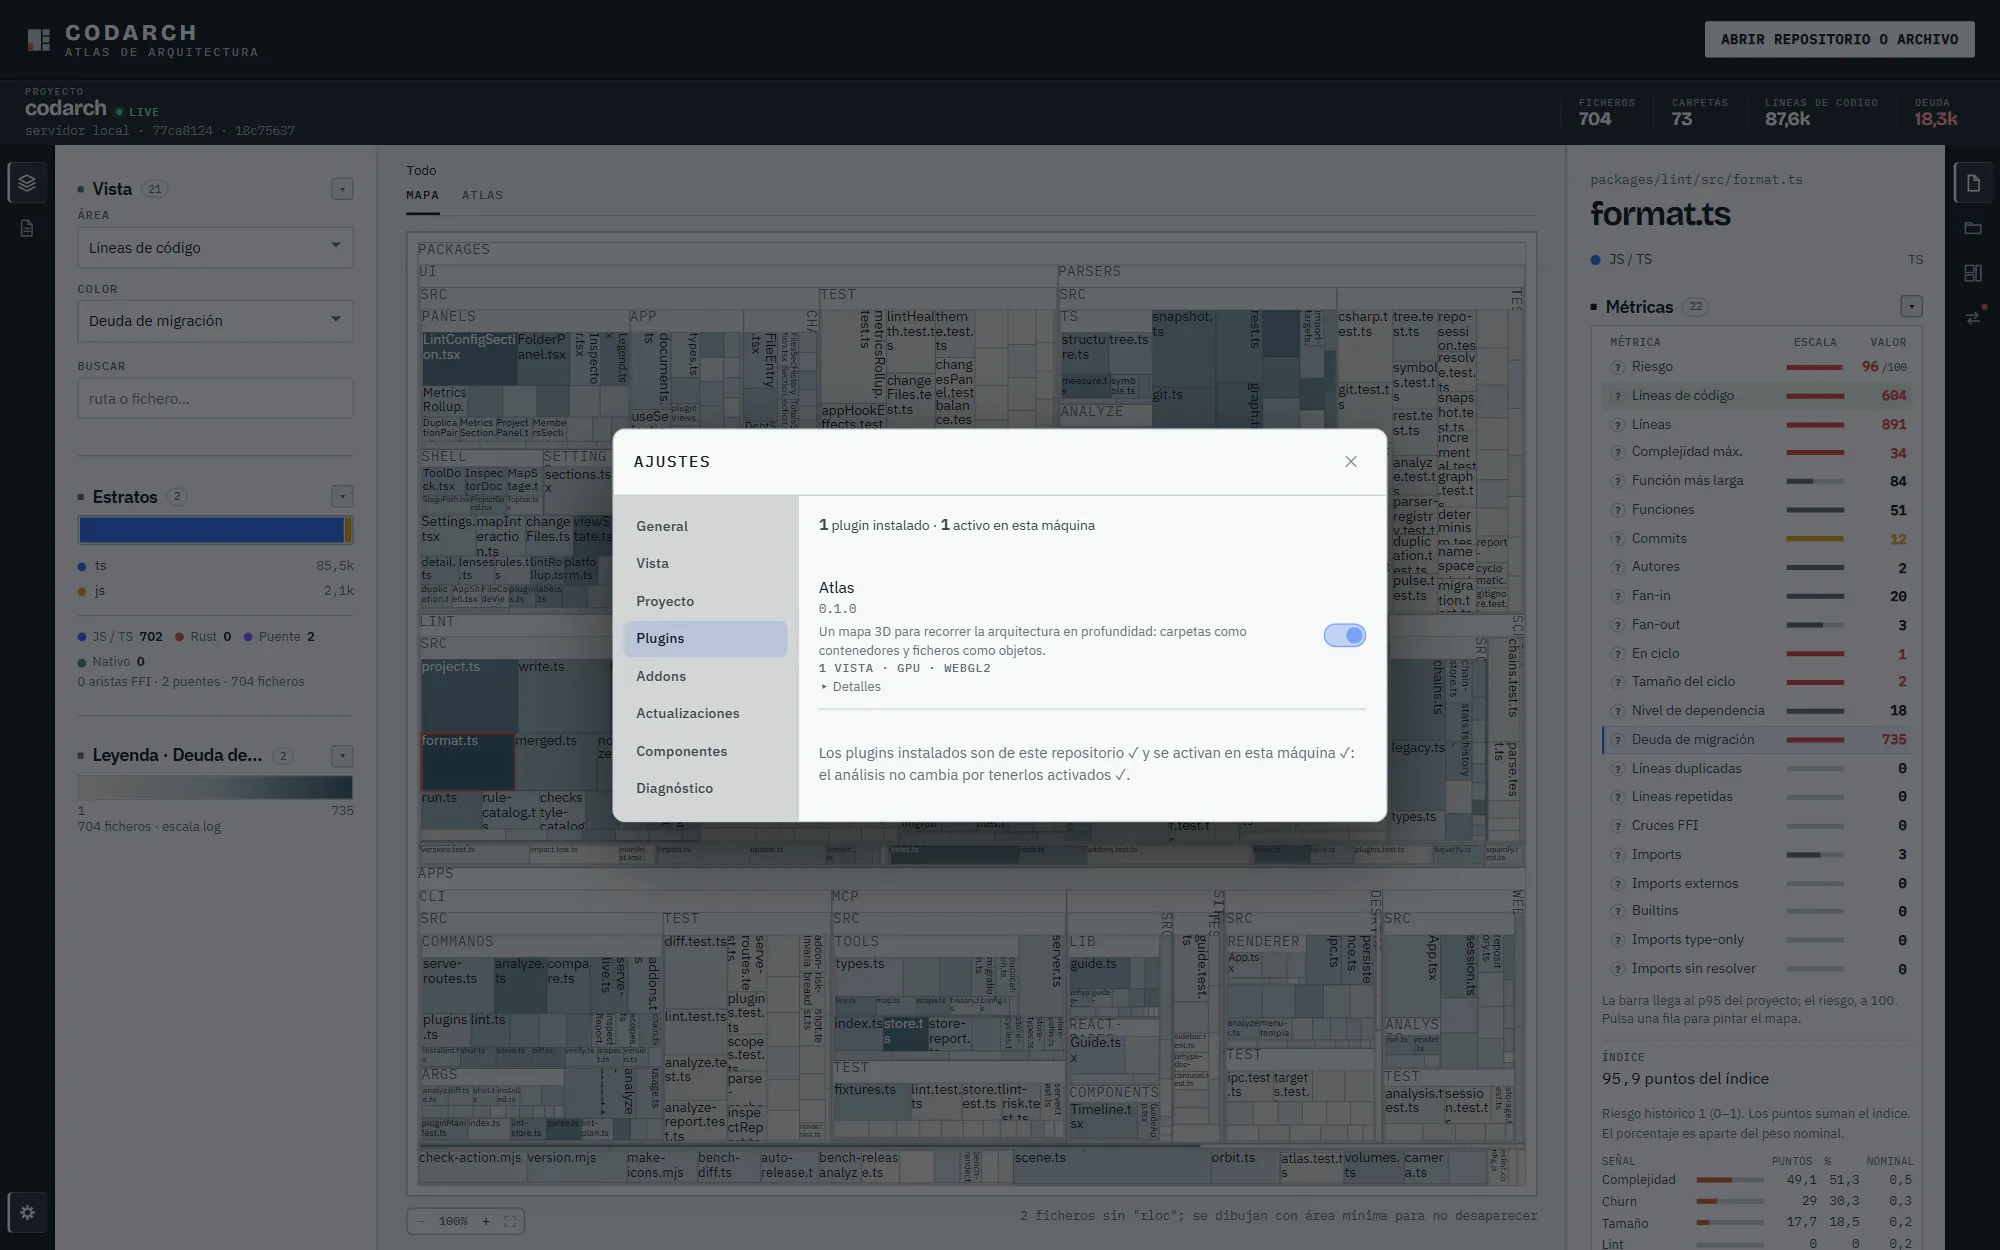
Section titled “Ajustes › Plugins and Ajustes › Addons”There is no plugin store or catalogue. Ajustes › Plugins lists the installed plugins and lets you
turn them on or off (for example, «Atlas»). The addons declared by the repo’s .codarch.yml are in
the separate Ajustes › Addons section. See Rules.
What it stores
Section titled “What it stores”Preferences (area metric, colour mode) live in the browser; the repo state, in its .codarch/
folder. The web app uploads nothing to any server.
A static map
Section titled “A static map”codarch render <snapshot> -o <folder> publishes the same interface as a static site with the
snapshot in data/: it can be served from Pages or any folder. See codarch render.